

The Mt. Blue Sky Anomaly
Ahead of the Colorado Fourteeners Initiative's 2025 trail use report, Quandary Magazine examines current trail use trends, including a strange spike that sent a new mountain into top five territory

The Colorado Fourteeners Initiative is poised to release their 2025 use report, which gives us a great snapshot of trail access and hiking habits.
In keeping with tradition, I am a full year behind in my analysis.
However: given that the Forest Service has just greenlit a plan I sardonically called “The Alpine Amusement Park,” when I predicted it back in 2022, the topic is once again back in the spotlight. These reports from CFI are some of the only reliable benchmarks giving us a look at whether these programs are helping, or harming the outdoor community.
Without further ado, here are my graphs:
The Big Picture
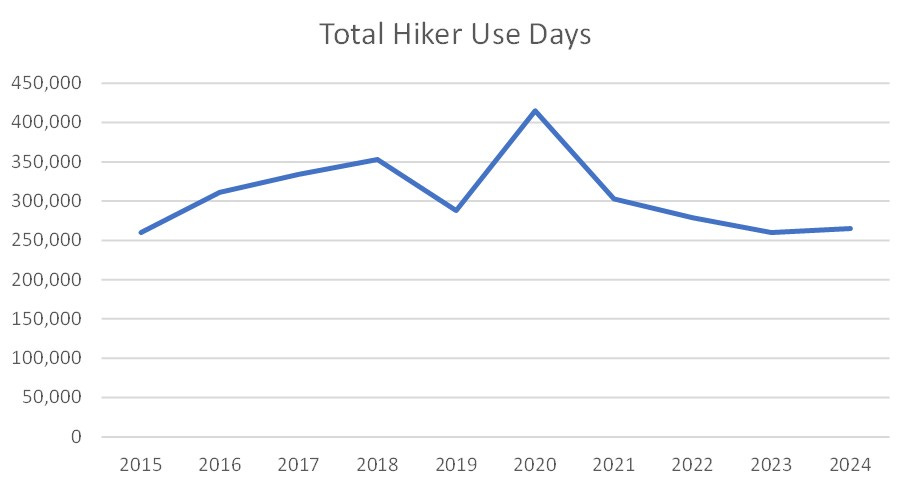
Colorado’s 14ers have stabilized, with 2024 attracting only 5,000 additional hiker use days* as 2015—the first year for which accurate data is available. But for reasons I’ll explain later, this 5,000 statistic may not be accurate.
*From here on out, I will be referring to Hiker Use Days as HUDs.
The reason we use HUDs instead of visitors, is because it’s impossible to know whether they translate into unique visitors. A single prolific hiker could be responsible for a dozen hiker use days in a given season. Some even climb multiple peaks in one outing.
It’s best to think of this measurement as one person, visiting one trail, on one day.
To complete this article, I’ve boiled down a decade of data into just a few nifty graphs. As always, I want to make the data transparent and available to you. All of the raw numbers can be found below in one convenient PDF:
I’ve also linked my analysis from the past four years, in case you’re curious how my predictions have held up over time.
The Nitty Gritty
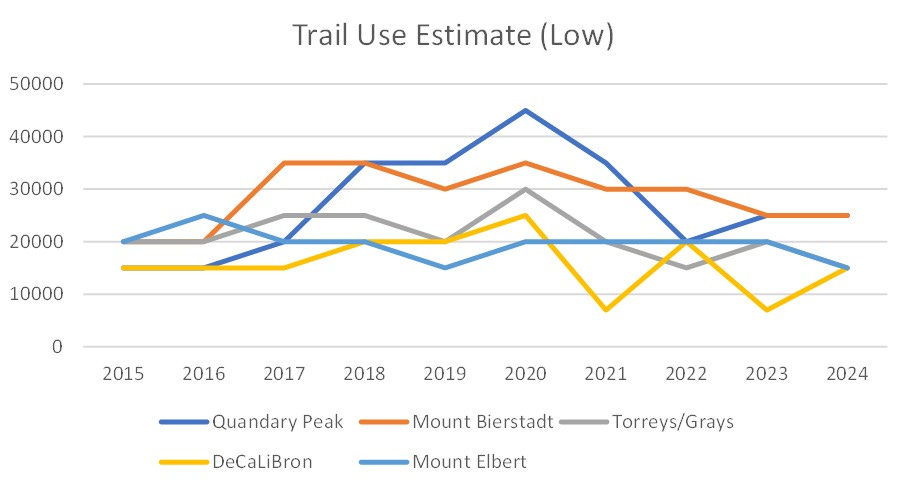
Last year’s herding trend continues. Colorado’s most popular peaks started off roughly equal in terms of popularity, before clear favorites started emerging. Clear break-away favorites emerged in 2016. But now that the mining claim/liability/access issue surrounding the DeCaLiBron loop has resolved, that trail has normalized.
(If you hadn’t heard: the Conservation Fund purchased the necessary land to ensure continued access.)
The Anomaly
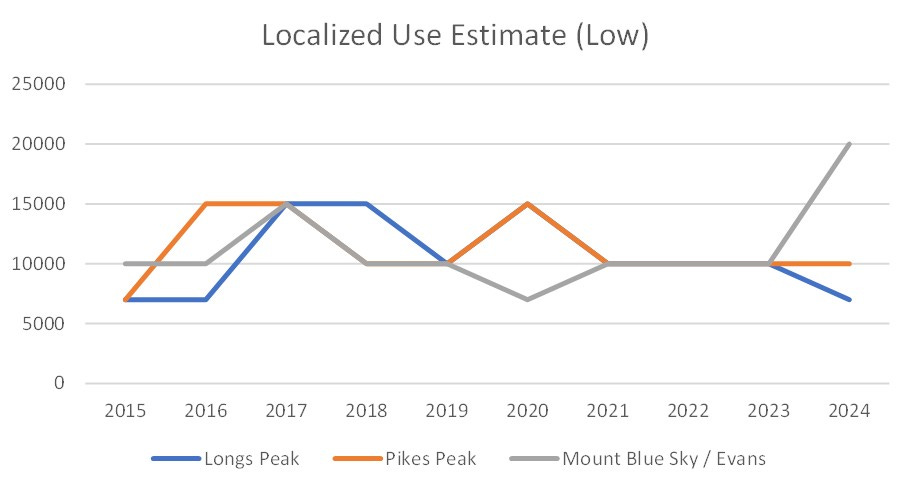
In last year’s report, DecCaliBron had lost its spot on the leader board. Now it’s back… in a FOUR WAY TIE with Mount Bluesky/Evans.
For anyone keeping tabs on this issue for the past few years like I have, that data point should strike you as very strange. This is a peak that sat at an extremely consistent 10,000 HUD level—aside from slight fluctuations in 2017 and 2020—for almost a decade. Then in 2024, hiker use days doubled.
Why?
I spoke about this with CFI’s Executive Director, Lloyd Athearn, and learned this is a data point that caught the organization’s attention as well. He was able to shed some light on why.
The long and short is that CFI doesn’t actually place counters on every single trail, every single year. Some are estimates derived from a statistical model, factoring in things like trail length and difficulty, in conjunction with overall trends. The problem is, CFI’s model might have been running the numbers based on a flawed assumption:
“Well, if you’re assuming that someone’s doing a route that’s like 20 plus miles from Echo Lake, I mean, it’s a real long haul. I’ve done that climb the mountain from there, and it’s a long trip. Whereas most people are probably driving into Summit Lake and doing a much shorter climb,” Athearn said. “When we realized that, ‘oh, that little formula might be wrong for this peak,’ then all of a sudden, it shot up dramatically. So that might be overestimating it too. We’ll find out.”
In other words: the model assumed hikers were taking the Echo Lake route, which probably led to an undercount based purely on the trail’s length. CFI attempted to correct this by running the numbers for Summit Lake Instead.
At only 5.5 miles according to 14ers.com, this route is a fraction of the distance.
In search of definitive answers, CFI has gotten permission from Denver Mountain Parks to put actual thermal counters on the trail this year. But because of the lag in data, we likely won’t see results until mid 2027.
Regional Trends
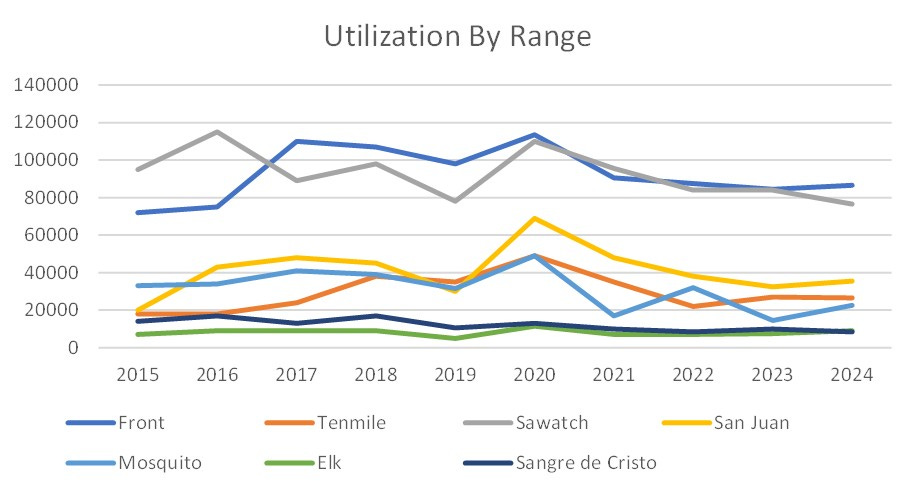
I also like to track the regional HUD, because I it paints an interesting picture of where people are traveling to hike, away from the major metro area around Denver.
There are no major trend-buckers here.
The Mosquito Range gained a few visits, but that’s to be expected now that the property access dispute around DeCaLiBron has largely resolved.
The Sawatch lost a few, but not enough to write home about.
And the Front Range stayed relatively flat. However, because Evans/Bluesky is likely an overcount, this may actually reflect a drop in visitors.
As I said last year: this graph is about consistency, not comparison. Some ranges draw more numbers because of their sheer quantity of peaks. The Tenmile range for instance, has a single 14er: Quandary. While popular, that one mountain still doesn’t chart above the San Juans, even though that range is home to 13 of the least visited peaks in the state.
Answers to the Questions I asked Last Year:
1 — Will total use days be greater or less than 260,000?
Greater, but barely.
2 — Did the Mosquito Range numbers increase?
Yes, about how you’d expect now the DeCaLiBron dispute is over.
3 — Will the San Juans continue to mirror statewide trends?
Yes, and I think this may be the most interesting data point I’ve noticed. While the other mountains see fluctuations relative to the statewide trend, the San Juans follow it almost perfectly. This isn’t really apparent when plotting them on the same graph because of the difference in numbers, but the correlation is certainly there.
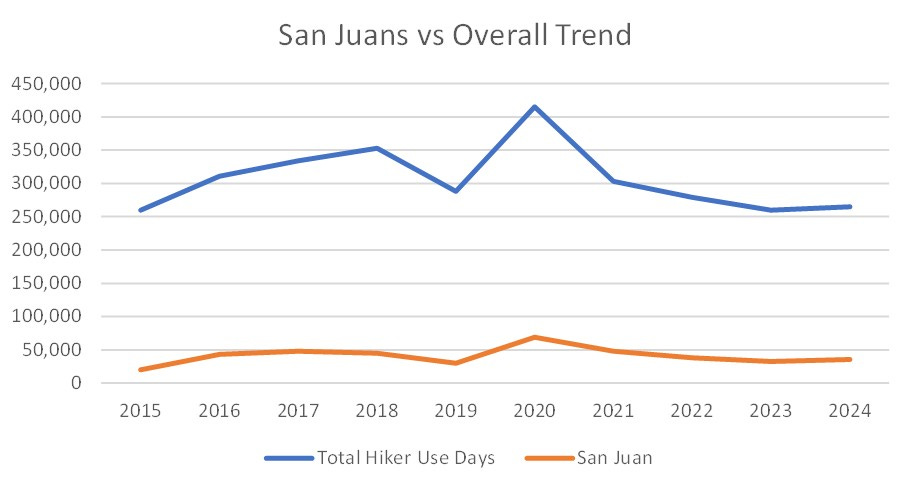
Last year, I theorized that because the San Juans are a kind of odd Bellwether, or microcosm of statewide outdoor recreation trends, possibly because their distance from the Denver metro area insulates them from more fleeting trends.
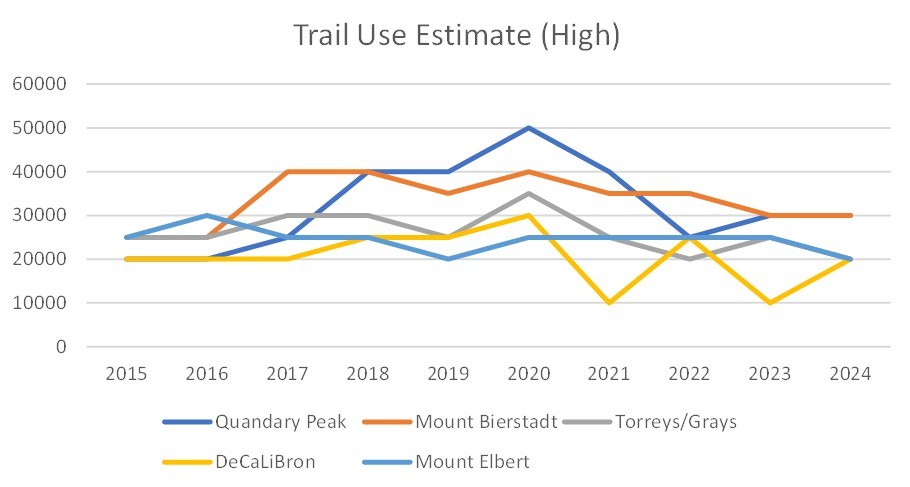
4 — Can Quandary Reclaim its title as most popular peak?
Maybe next year. It’s currently tied for first place in both the high and low models. I haven’t seen the 2025 data yet, but my prediction is that Quandary retakes the crown, mostly because of illegal parking crackdowns by Bierstadt’s trailhead.
This led to some hikers returning from the summit to find themselves stranded at the trailhead. Guanella pass was probably long due for some kind of enforcement; I predicted years ago that Bierstadt would eventually get the same treatment Quandary did. It seems like the time has finally come.
5 — Are the Longs/Pikes/Blue Sky HUD numbers still tracking together?
No, because of the modeling anomaly mentioned above.
What I’m Watching for 2025
Bierstadt. I alluded to this above, but nearby Georgetown has been having serious tourism traffic troubles in the past year, most notably during the fall of 2025 when the town got so crowded it simply closed, checking ID’s and only allowing residents back in. I’m curious to see whether this changes how the town tackles outdoor tourism.
To a lesser extent, I will be keeping tabs on the San Juans. But I think there is already enough data to prove they are at least tracking alongside state trends in an unusual way. I just don’t know why.
What are you most curious to see in the 2025 report? Let me know in the comments, and I’ll try to address your questions in my upcoming analysis!